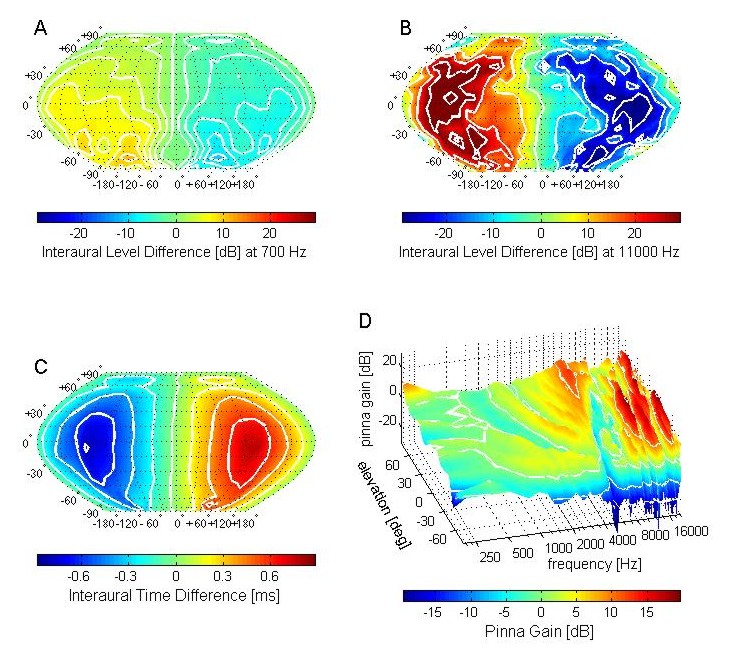
This figure shows acoustic cues to sound source direction. It is a color version of Fig. 5-2 of "Auditory Neuroscience", and is based on acoustic recordings from my own ears carried out by Prof Doris Kistler at the University of Wisconsin at Madison.

The data are shown as spherical map projections, with my head at the centre of the sphere, and the interaural cue values shown by the color codes for the corresponding sound source directions in azimuth and elevation. A and B show interaural level differences (ILDs) in decibel. As you can see, ILDs are highly frequency dependent, i.e. high frequencies (say near 11 kHz, panel B) can generate large ILDs of 30 dB or larger, while lower frequencies (say near 700 Hz, panel A) generate ILDs of well below 10 dB.
ILDs are also significantly affected by the geometry of the head, outer ears, and shoulders, which is why the patterns of the ILDs are much more irregular than the Interaural time difference (ITD) patterns shown in C. ITDs are nearly spherically symmetric around the interaural axis, are much less frequency dependent, are maximal for positions right off to one side of the head, and never exceed values of 700 microseconds or so.
ITDs and ILDs are both valuable cues for localizing sound sources, but even individuals who are deaf in one ear can sometimes localize sounds in space with some degree of accuracy. These judgements are thought to be based on monaural spectral cues (shown in D for sound source locations right in front, 0 degrees azimuth, at various elevation). Spectral cues arise because the outer ear filters sounds in a manner that depends on the angle of incidence of the sound waves, creating patterns of peaks and notches in the high frequency end of the sound.
